


Trading the Markets: Candlestick Patterns

Last time in this series, I talked about different types of charts you can use to do your analysis. Check it out here if you haven’t. And I said, candlestick charts are the most used ones, and in all of the articles after this one, I’ll use these charts to explain stuff. So today this is a primer on different types of candlestick patterns and the differences between them.
Keep in mind, some of these patterns have random names. Don’t try and remember any of the names, just try and understand what the patterns represent. I myself was reminded what some of these were called when researching for this article.
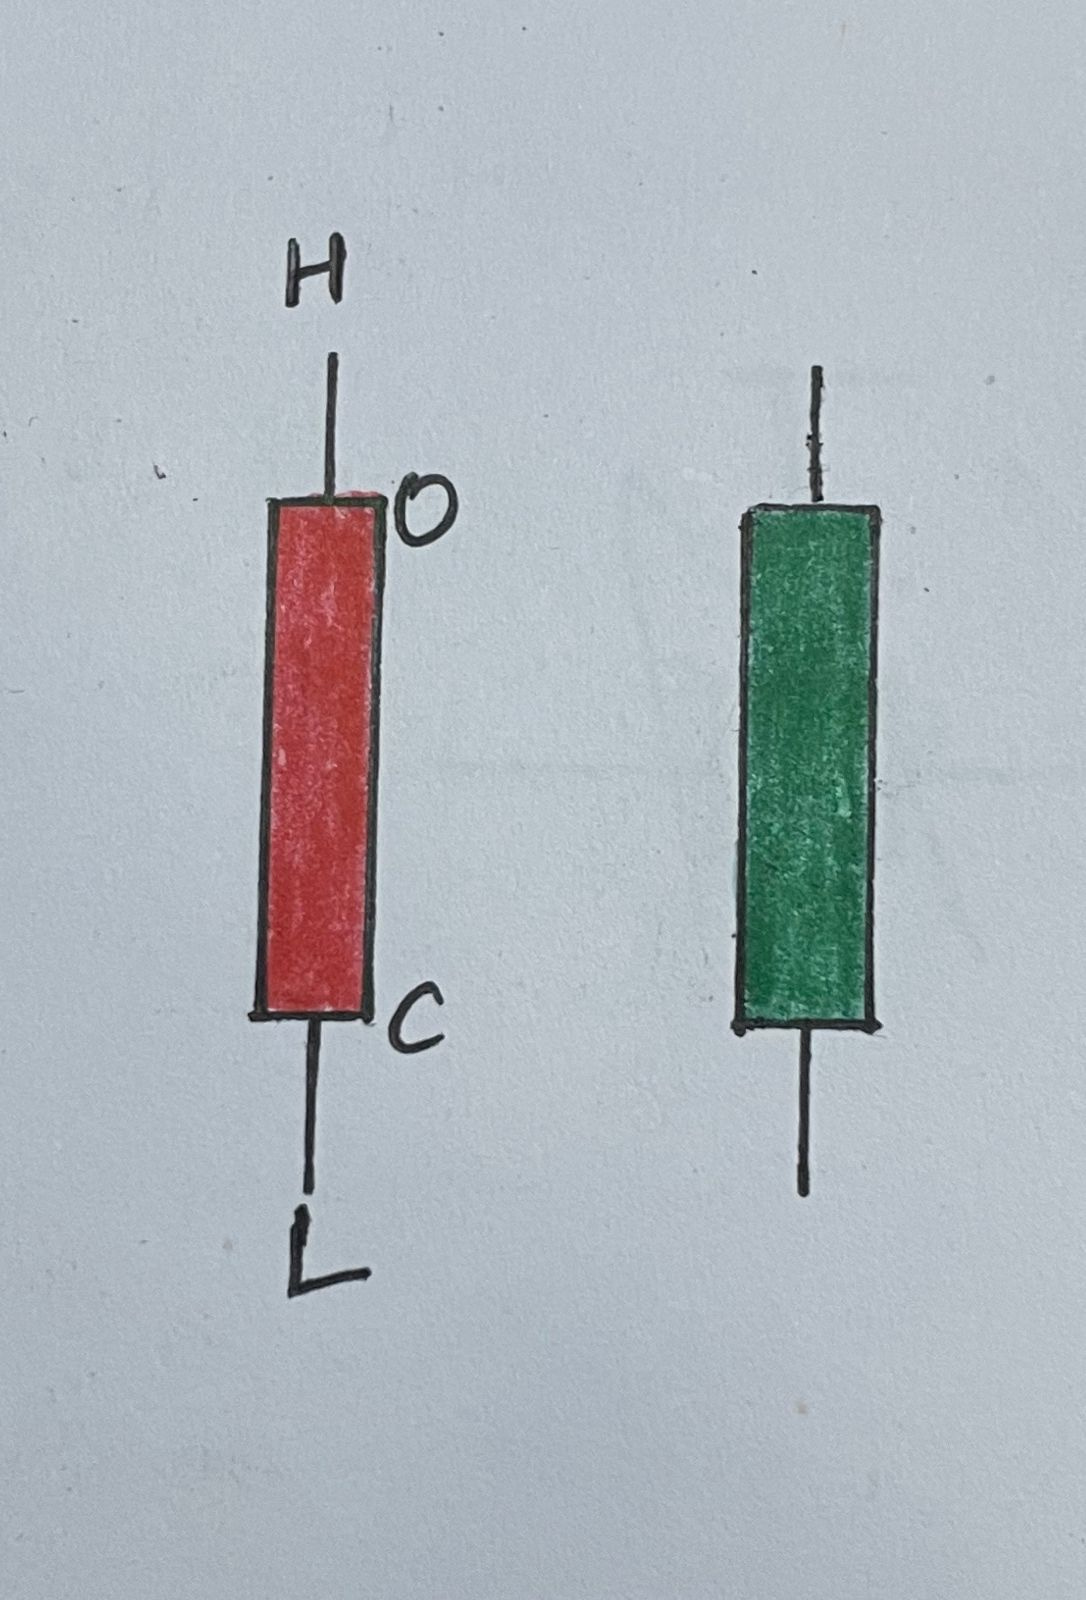
So last time I explained that by default most platforms use the colour green for bullish candles and red for bearish ones. Think of how a bull strikes someone with its horns, in an upward movement, hence the word “bullish” for candles showing upward movement. And think of how a bear strikes down on its opponent, in a downward movement, hence the word “bearish” for candles showing downward movement. Also keep in mind that the lines that show the highs and lows of a candle are called “wicks”, to keep up with the analogy of “candles”.
Coming to patterns. (I have attached an example at the bottom of the article if my theoretical explanations aren’t as clear as I’d like)
Hanging Man, Hammer and Shooting Star
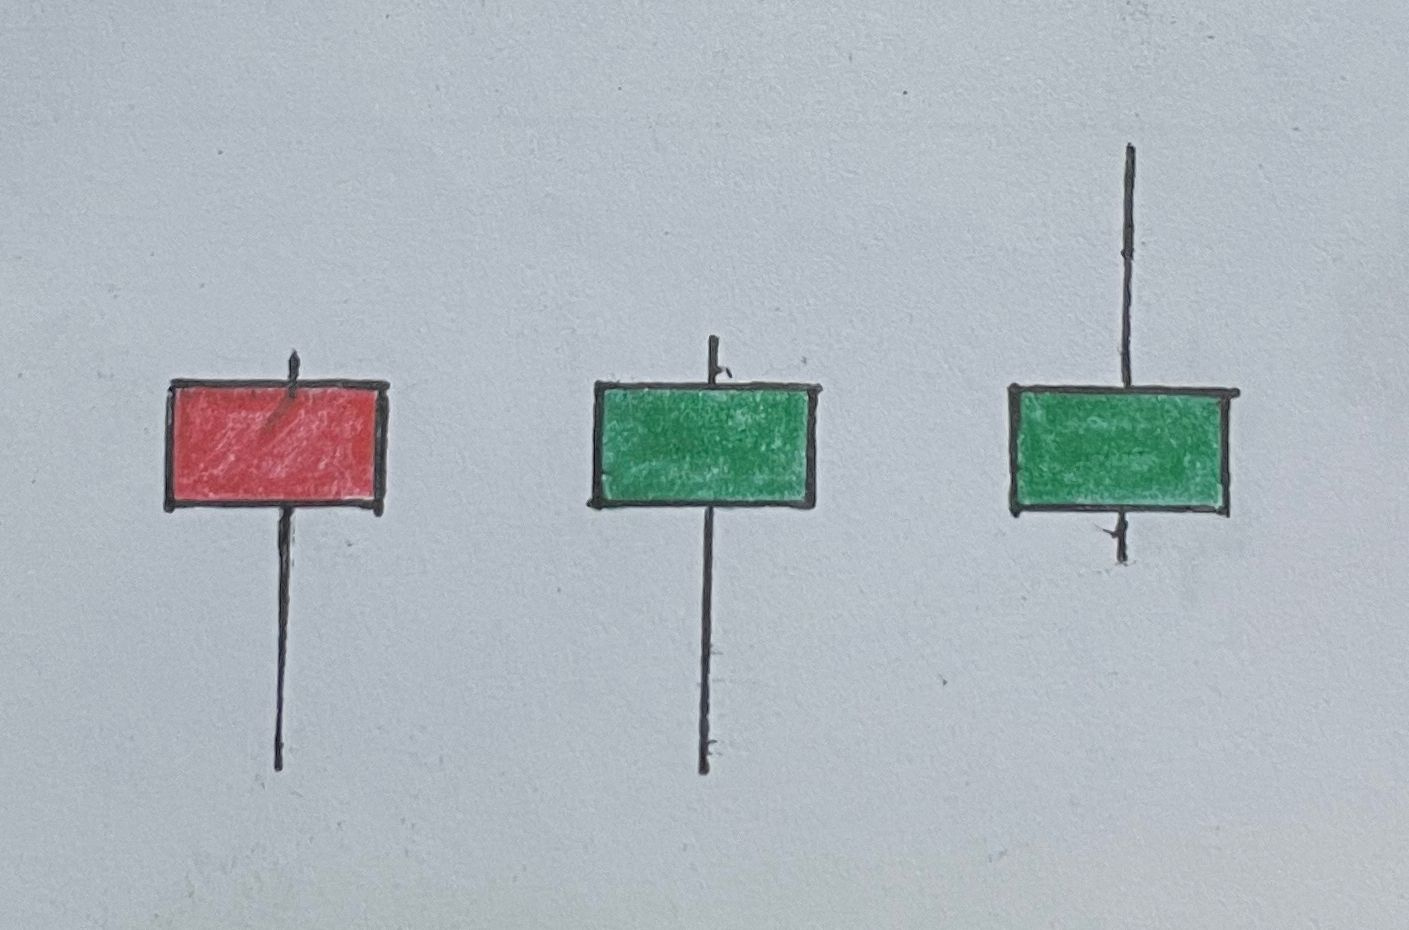
This type of candle with a small body and longer wicks on one end would be called a “Hanging Man” when there was a bullish trend and now a red candle has formed (even with a long wick at the bottom) and the bears might come in.
A “Hammer” is formed when there was a previous bearish trend and now due to the formation of a candle with a big wick at the bottom it might be time for the bulls to come in and push the price up.
A “Shooting Star” forms when there was a bullish move and now there is a candle with a long wick at the top (the candle could be red or green), and now there could be selling pressure. This is so since what it signifies is that there is more selling pressure than buying pressure.
Now you know what a directional candle looks like. Have a look at the candles below, these are indecision candles.
Spinning Top and Doji
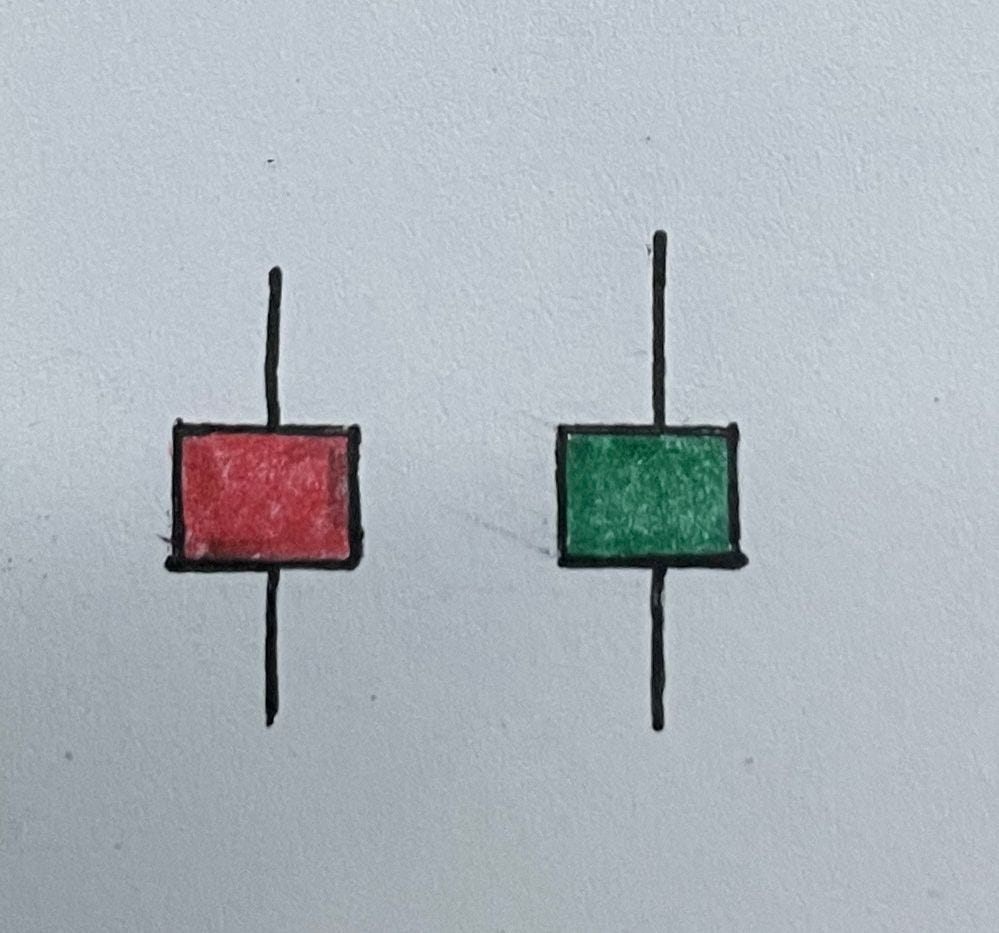
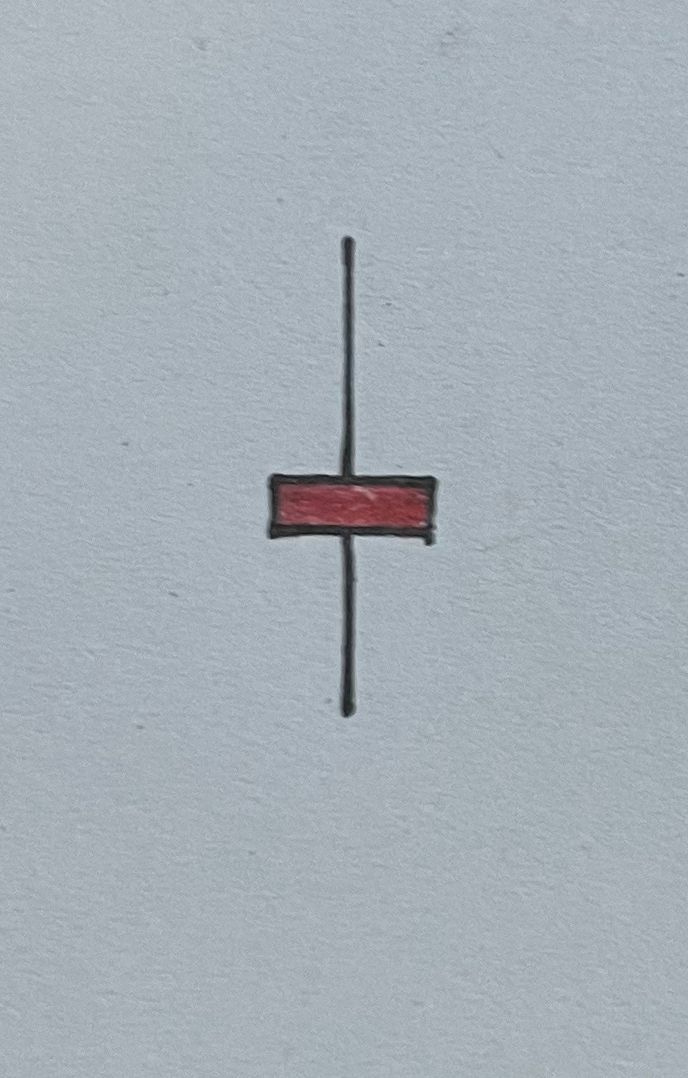
Spinning Top and Doji Candles are “indecision” candles because they represent a war between buyers and sellers where in the end, there was no clear winner. This is shown in the fact that the wicks on both sides are significant in comparison to the bodies. Until there is a clear push in either direction you can’t be sure of the movement.
Let’s see all these candles in action in an actual stock’s daily movement.

I’ve marked some candles in the picture. On the basis of things you already know now, you can identify the names, and more importantly, the psychology behind the candles and price movements afterwards.
I think that’s enough to digest for today, we’ll look at candlestick patterns involving multiple candles and what they signify tomorrow. Check that out here. Meanwhile, you can play with charts at https://in.tradingview.com/.
Subscribe for free to receive new posts and support my work. And do let me know if you want a specific topic covered!
P.S. You can read all my articles here.