


Trading the Markets: Charting

In the previous article in this series, I discussed what technical analysis is. Read that here if you haven’t. In this article, we’ll discuss, in my opinion, the most important tool used in technical analysis - charts.
Charts are basically the visual representation of price movements of whatever asset you want to buy/sell/watch. There are many different types of charts that can be used to trade, let’s discuss the most used three. Remember the OHLC terminology we learnt last time, that will come in handy. Also keep in mind, “bullish” means upward movement while “bearish” means downward movement. Think of how a bull strikes someone with its horns, in an upward movement, hence the word “bullish” for candles showing upward movement. And think of how a bear strikes down on its opponent, in a downward movement, hence the word “bearish” for candles showing downward movement.
Line Charts
These charts only need one data point for each point in time - the closing price. If you want to look at the monthly chart, it will show the closing price for the month. If you want to look at the 1-minute chart, you get the idea. Fairly easy to understand. It looks like this.

Bar Charts
This type of chart shows all four data points - OHLC. The left horizontal line signifies the open price while the right one signifies the close price. If the left line is higher than the right one, it is a bearish candle (since C < O) and if the right line is higher than the left one, it is a bullish candle (since C > O). A single bar looks something like this.
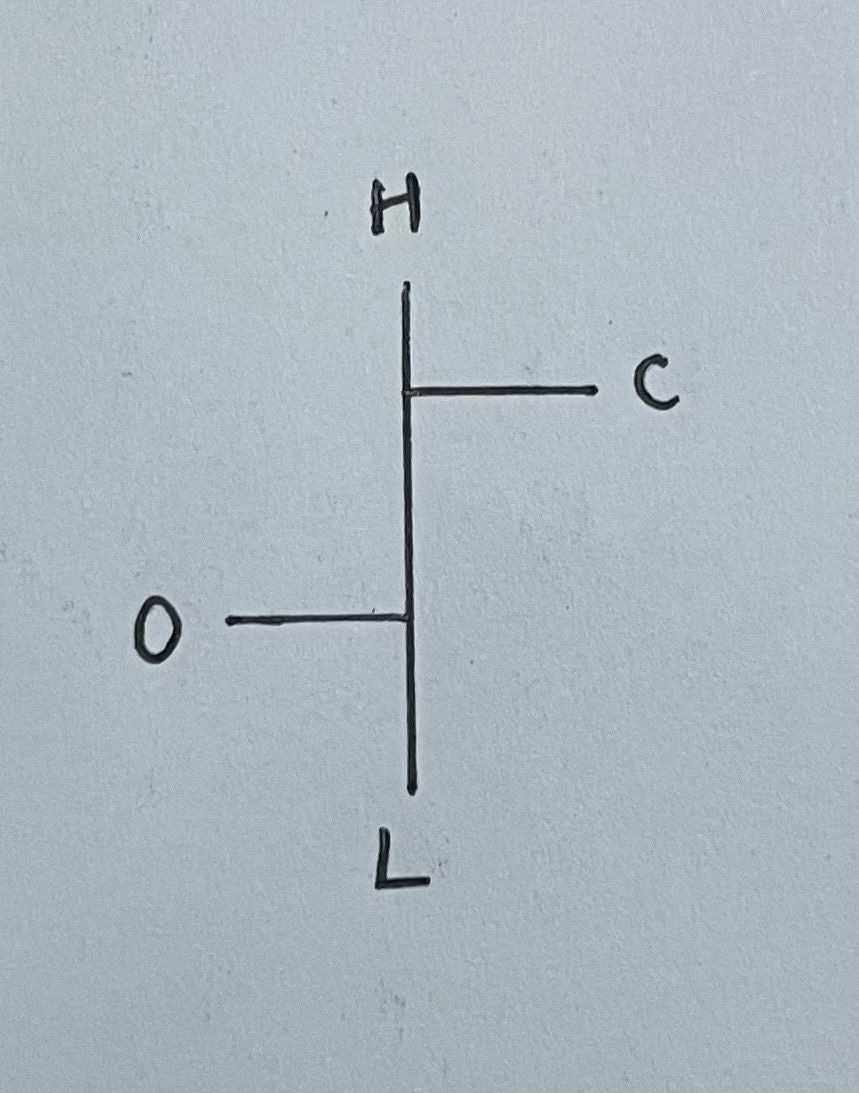
You can choose your own colour scheme but by default, most platforms would have bullish bars (C > O) as green and bearish (C < O) as red. A bar chart in full flow looks like this.

Candlestick Charts
This type of chart is the most widely used by traders around the world since it gives a very clear picture of the movement. Candlestick charts also show all four data points - OHLC. A single candle looks something like this.
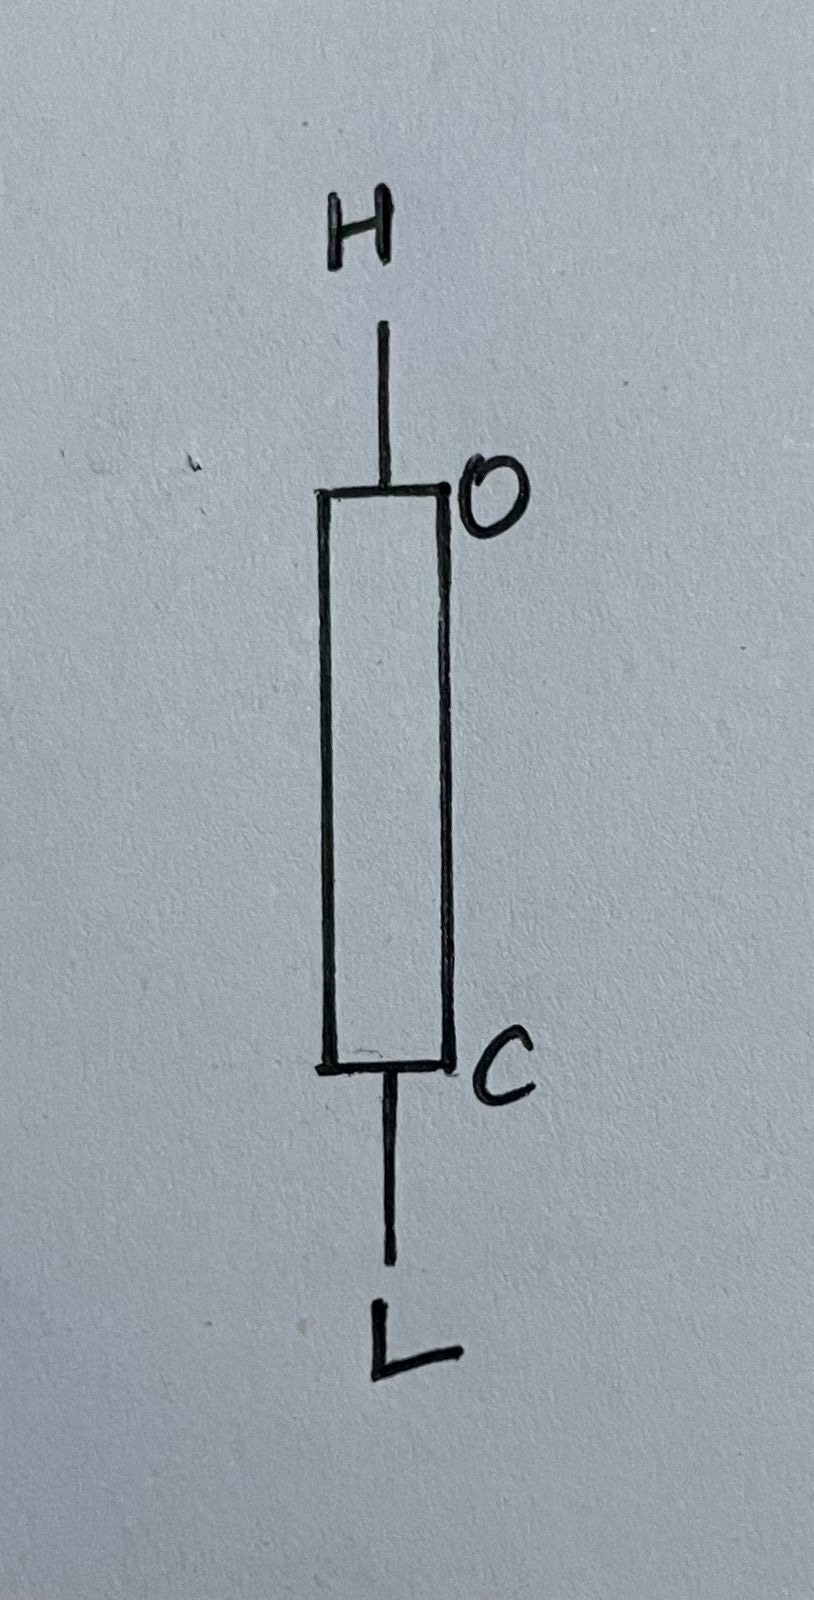
You can choose your own colour scheme but by default, most platforms would have bullish candle (C > O) bodies as green and bearish ones (C < O) as red. A candlestick chart in full flow looks like this.

Time Frames
You can view all these types of charts, plus more in whichever timeframe suits you best. You can choose from the 1 Year time frame (Each candle represents the price movement through a year) up to the 1 Second time frame (Each candle represents the price movement during a second). Based on your trading/investing style, you need to choose a time frame that best suits you. This is crucial for your success in the markets because you need to be able to extract all the necessary information and ignore the noise.
Hope you learnt something from this article. Read more about candlesticks here. Meanwhile, you can play with charts at https://in.tradingview.com/.
Subscribe for free to receive new posts and support my work. And do let me know if you want a specific topic covered!
P.S. You can read all my articles here.