


Trading the Markets: Supports & Resistances

Last time in this series we talked about candlestick charts. Check that out here if you haven’t. Let’s go on to the next part of the process: identifying supports and resistance.
First, what are supports and resistance? As the names suggest, a “support” zone is a zone where the price is prevented from falling more, meaning the price is “supported”. Similarly, a “resistance” zone is a zone where the price is prevented from rising more, meaning there is “resistance” to the price. Let’s look at examples of how to draw these zones now.
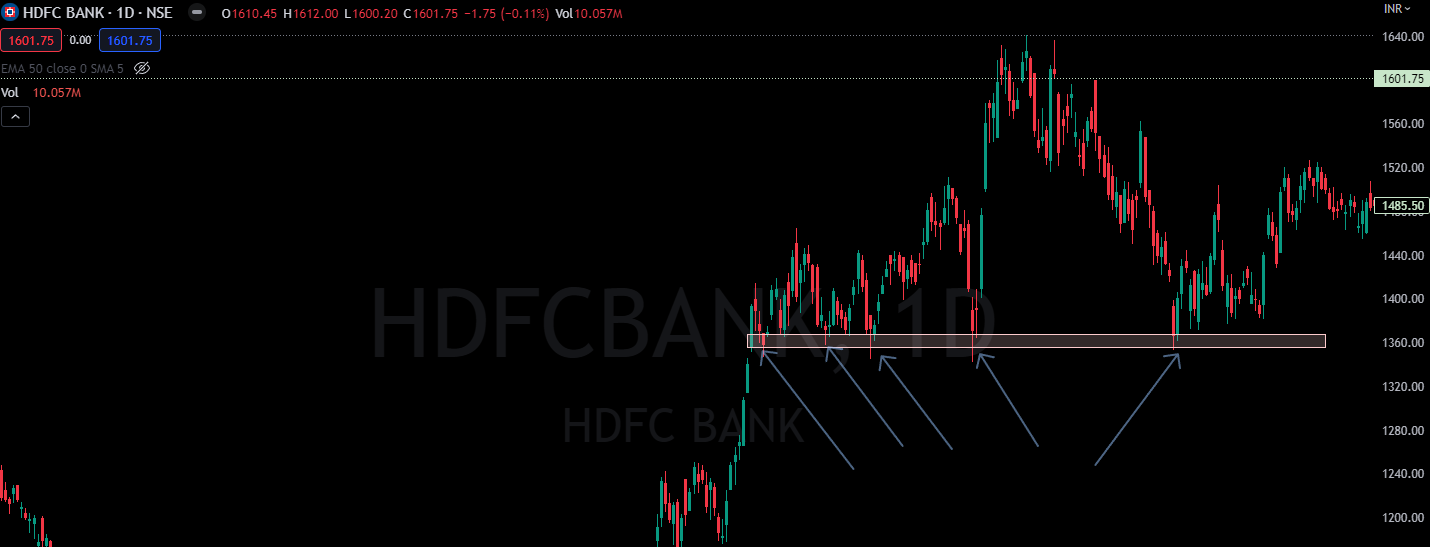
The Support Zone formed over time “supported” the price again when the price late came to that area.

The Resistance Zone formed over time “resisted” the price again and again until the price eventually broke through.
Keep in mind while you form your S&R zones that you should, at least I myself, take at least 3 points whenever creating a zone, since you need enough proof that price reacts to a particular zone. But remember, however much you think a support or resistance zone should lead to a reaction from price, your view can be negated since the market does not have to conform to any of our views. The actions of even a single trader could lead to the breaking of the zones that thousands of people were dependent on.
Now when a particular zone is invalidated, what generally happens is that a support zone is converted into a resistance zone and vice-versa. Let’s understand why this happens. Let’s say stock A has a resistance band from $98-$100. Person A sells the stock at $99 and it is then also sold back down to $95. The next time the stock approaches $100, again people start selling, but this time it crosses the zone and goes to $110. The next time the price of the stock goes near $100, what would you do? Naturally, you would like to buy near that price range and new buyers would also come in at that price since nobody wants to miss that up move from $100 again. Let’s see this happen through a real example.

As you can see, a support zone was created, which then turned into a resistance zone when the price broke through and came back around there, and then the zone again turned into support when the price broke back above.
Obviously, these zones alone should not be used for your trading decisions, they only show POSSIBLE zones of reversal. You can incorporate these zones in your trading plan to give you additional confluences. I will talk about creating your own trading plan in a later article. But that’s it for the theory on S&R from my side. You can explore charts on your own at https://in.tradingview.com/.
Subscribe for free to receive new posts and support my work. And do let me know if you want a specific topic covered!
P.S. You can read all my articles here.